

What Is Performance Marketing? A Complete Guide With Formulas, Benchmarks and Real Numbers

Harsh Rajput · Sr. SEO Executive · 3 years' experience · 21 August 2026 · Updated 15 September 2026 · 18 min read
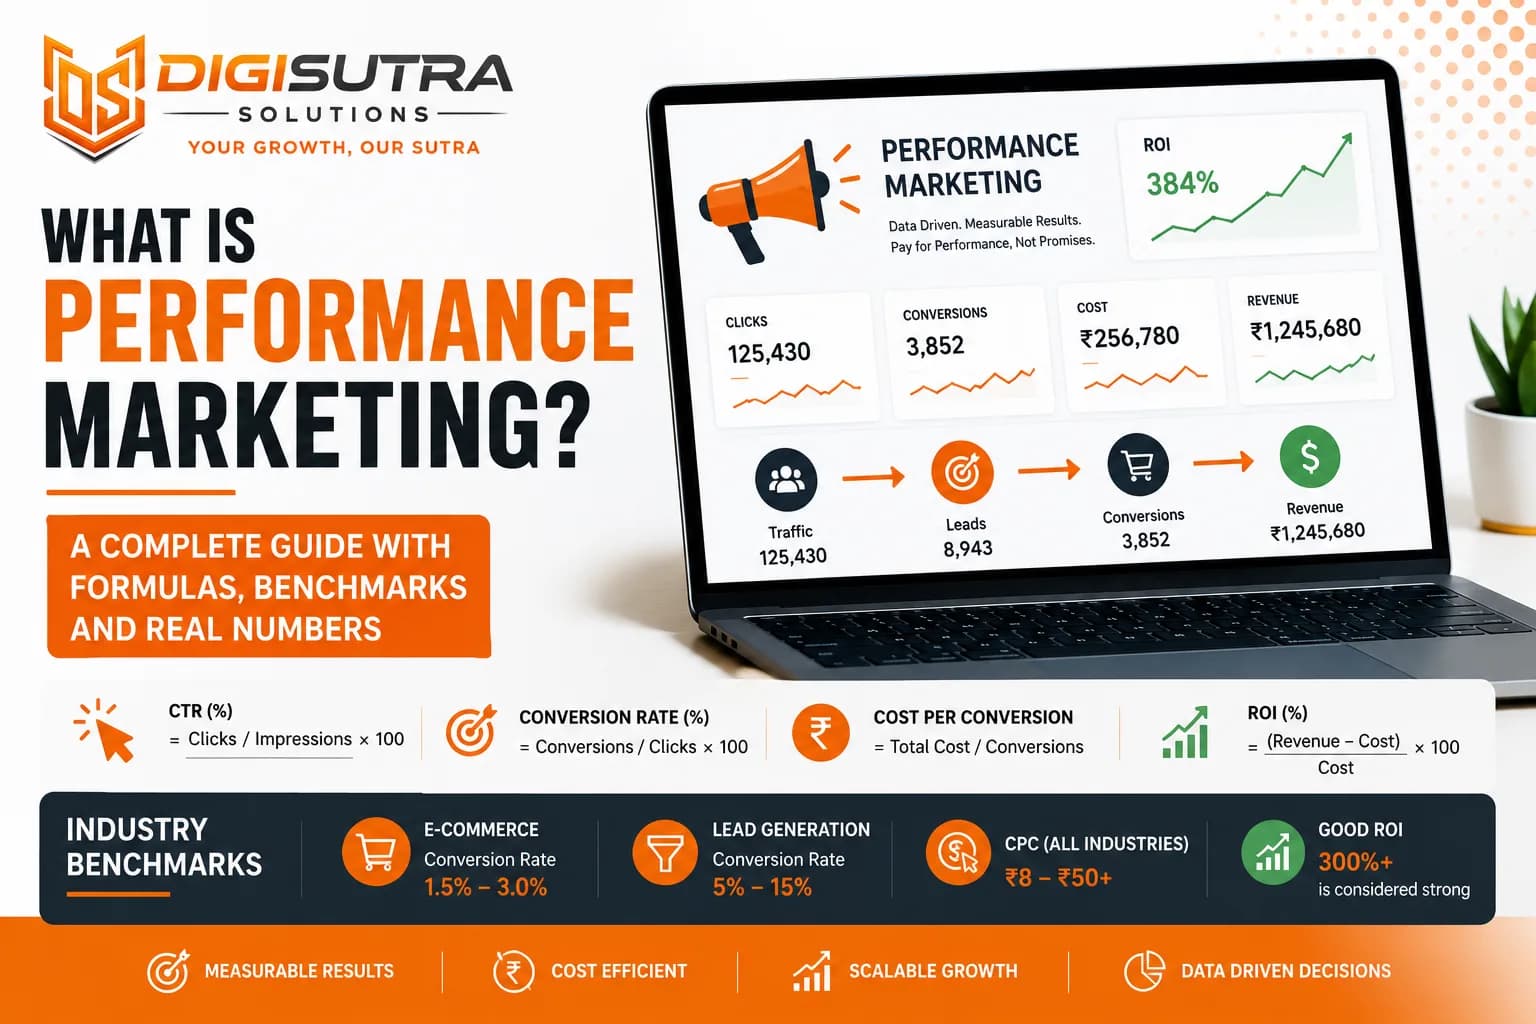
Key takeaways
- Performance marketing is an advertising model where payment is tied to a result instead of to exposure.
- These three get confused constantly.
- Most explanations describe a campaign as something you launch.
- Agencies and platforms quote different models and the wording matters more than people realise.
Performance marketing is paid advertising where you pay only when a specific measurable action happens. A click. A lead. A sale. An app install. No action means no charge.
Some people search for this as performance based marketing and some type performance in marketing. All of it points to the same idea. You buy outcomes instead of buying exposure.
The definition takes one line. The part that decides whether you make money or lose it is the arithmetic underneath, and most guides skip it entirely. What a click should cost you. What return you need before you break even. Why your ad dashboard reports more revenue than your bank account ever sees.
This guide starts with the plain definition then goes straight into the numbers. You get every payment model explained, every metric with its formula, honest benchmark ranges to judge your own campaigns against, one full campaign worked through with real math, what the job looks like week to week, and a straight section on who should not be spending on ads yet.
What Performance Marketing Means in Plain English
Performance marketing is an advertising model where payment is tied to a result instead of to exposure. You decide in advance what counts as a result. The platform or partner delivers it. You pay for each one that lands.
The Four Traits That Define It
Payment follows outcomes rather than impressions or airtime
Everything is traceable from first click through to the order
Budgets move daily instead of being locked for a quarter
It spans many channels rather than living on one platform
What It Is Not
Not free traffic. You still spend money, just against results
Not the same as affiliate marketing. Affiliate is one channel inside it
Not SEO. SEO earns traffic slowly and keeps working after you stop paying
Not a fix for a weak product or a broken website
Performance Marketing vs Brand Marketing vs Traditional Advertising
These three get confused constantly. Here is the honest split.
Performance marketing | Brand marketing | Traditional advertising | |
You pay for | Clicks, leads or sales | Reach and recall | Space or airtime |
Main goal | Revenue now | Recognition over time | Broad awareness |
Measured by | ROAS CPA CAC | Recall and share of voice | Estimated reach |
Feedback speed | Same day | Months | After the campaign |
Budget behaviour | Scales with results | Fixed per period | Booked in advance |
Biggest risk | Scaling a losing campaign fast | Hard to prove impact | Money gone before results |
Two More Terms People Mix Up
Growth marketing is broader. It covers acquisition plus activation, retention and referral. Performance marketing is the paid acquisition slice of it
Direct response is the older offline cousin. Mail shots and infomercials chased immediate action too, but payment was rarely tied to the result
Which One Your Business Needs First
New business nobody knows — performance first, so you learn what people actually buy
Established brand plateauing — add brand work, because rising ad costs often come from low recognition
Local service business — performance first, almost always
Category nobody knows exists — education first, or your ads collect clicks and no sales
Brand work makes performance cheaper over time. Warm audiences click more and convert better. The two are not rivals.
How Performance Marketing Works Step by Step
Most explanations describe a campaign as something you launch. In practice it is a loop you run.
The Loop
Define the action you will pay for and what it is worth to you
Set up tracking so that action gets recorded reliably
Pick channels where your buyers already spend attention
Launch with a test budget you can afford to lose completely
Wait out the learning period without touching settings
Read the data at channel level, not just account level
Cut losers and feed winners in small increments
Repeat weekly, because costs and competitors keep shifting
Who Gets Paid and When
Three parties usually sit in the chain.
The advertiser is you. You set the target and pay for results
The platform or publisher shows the ad and earns per click or per action
The tracking layer records what happened and settles who earned what
On Google and Meta the platform and the tracking layer are the same company. On affiliate networks they are separate, which is exactly why affiliate deals need independent tracking.
The Payment Models You Will Be Quoted
Agencies and platforms quote different models and the wording matters more than people realise.
Model | You pay per | Best for | Risk sits with |
CPM | 1,000 impressions | Awareness and reach | You |
CPC | Click | Traffic and testing | Shared |
CPV | Video view | Video campaigns | You |
CPL | Qualified lead | Services and B2B | Partner |
CPA | Completed action | Sign-ups and downloads | Partner |
CPS | Sale | Ecommerce and affiliate | Partner |
CPI | App install | Mobile apps | Partner |
Revenue share | Percentage of sale | Affiliate and creators | Partner |
How to Choose Your Model
Selling a physical product = CPS or CPA keeps you protected
Selling a service with a sales call = CPL, but define "qualified" in writing before signing
Entering a new market = CPC gets you data fastest
Launching an app = CPI, with a retention check after install
Working with creators = revenue share keeps everyone pointed the same way
A partner pushing CPM for a conversion goal is moving risk onto you. Sometimes that is fair. You should just know it is happening.
Every Performance Marketing Metric With Its Formula
This is the section most guides leave out. Learn these and you can read any ad account.
Metric | What it tells you | Formula |
CPM | Cost per thousand impressions | (Spend ÷ Impressions) × 1000 |
CPC | Cost per click | Spend ÷ Clicks |
CTR | Click through rate | (Clicks ÷ Impressions) × 100 |
CVR | Conversion rate | (Conversions ÷ Clicks) × 100 |
CPL | Cost per lead | Spend ÷ Leads |
CPA | Cost per acquisition | Spend ÷ Conversions |
ROAS | Return on ad spend | Revenue ÷ Spend |
CAC | Customer acquisition cost | Total sales and marketing cost ÷ New customers |
AOV | Average order value | Revenue ÷ Orders |
LTV | Lifetime value | AOV × Orders per year × Years retained |
MER | Marketing efficiency ratio | Total revenue ÷ Total ad spend |
The Three Numbers That Decide Everything
Dashboards show thirty metrics. Three of them actually decide whether you keep spending.
MER tells you whether advertising is growing the whole business, with no attribution argument attached
Contribution margin per order tells you whether an order was worth having once every cost is counted
LTV to CAC ratio tells you whether the model works at all. Aim for 3:1 or better
Work Out Your Break Even ROAS Before You Spend Anything
Copying a ROAS target from a blog post is the most expensive common mistake in this field. Your break even comes from your own margins and nobody else's.
The Formula
Break even ROAS = 1 ÷ contribution margin
Contribution margin is what survives from an order after product cost, shipping, payment fees, packaging and returns. Not after salaries and rent. Only costs that move with each order.
What Your Margin Means for Your Target
Contribution margin | Break even ROAS | Healthy target |
60% | 1.7x | 2.5x and above |
50% | 2.0x | 3.0x and above |
40% | 2.5x | 3.5x and above |
30% | 3.3x | 4.5x and above |
20% | 5.0x | 6.5x and above |
A skincare brand on 60% margin grows comfortably at 2.5x. An electronics reseller on 20% margin is losing money at 4x while the dashboard glows green. Same number, opposite verdict. Running your own figures through an ROI calculator takes ten minutes and saves months of quiet losses.
A Real Campaign Walked Through With Numbers
Definitions only carry you so far. Here is the arithmetic on a small ecommerce campaign.
The Setup
Product sells for ₹2,000
Product cost, shipping, packaging and fees total ₹1,200
Contribution margin is ₹800, which is 40%
Break even ROAS is 1 ÷ 0.40 = 2.5x
The Month
Line | Value |
Ad spend | ₹1,00,000 |
Impressions | 8,00,000 |
Clicks | 12,000 |
CTR | 1.5% |
CPC | ₹8.33 |
Orders | 250 |
Conversion rate | 2.08% |
Revenue | ₹5,00,000 |
ROAS | 5.0x |
CPA | ₹400 |
What It Actually Earned
Gross margin on 250 orders is 250 × ₹800 = ₹2,00,000. Take out the ₹1,00,000 of ad spend and the campaign produced ₹1,00,000 of real profit.
Now change one number. If 30% of those orders were cash on delivery and came back undelivered, you keep 175 orders. Margin drops to ₹1,40,000, profit falls to ₹40,000, and true ROAS is 3.5x rather than 5x. Same dashboard, very different business.
That calculation is the difference between a brand that scales and one that quietly bleeds. Stores dealing with this daily will recognise it from our deeper breakdown of performance marketing for ecommerce.
Channels That Run on a Performance Model
Not every channel suits the model equally.
Search and Shopping Ads
Catch people already looking for what you sell
Highest intent and usually the steadiest return
Costs climb fast in crowded categories
For shopping campaigns, feed quality beats bid tinkering
Paid Social
Creates demand instead of capturing it
Creative quality drives most of the result now that targeting has narrowed
Needs a longer judging window than search
Works best when the product is visual or explains itself quickly
Retargeting
Highest return of any paid channel and the easiest to overspend on
Capped by how many people visited in the first place
Segment by behaviour, because a cart abandoner is not a blog reader
Cap frequency or you annoy buyers who were already coming back
Affiliate and Influencer
Pure pay for outcome when structured on commission
Commissions typically run 10% to 30% of sale value
Coupon and cashback partners often claim credit for sales you had already won
Smaller creators usually return better engagement per rupee than large accounts
Native, Display, Connected TV and Retail Media
Native ads sit inside editorial content and suit longer explanations
Display earns its place in retargeting and struggles at cold acquisition
Connected TV now offers household targeting with measurable view-through
Retail media networks let you advertise inside the shop where people already buy
Email, SMS and Messaging
The cheapest revenue in the stack and the most neglected
Abandoned cart, browse abandonment, post purchase and win-back cover most of the value
Messaging open rates in India run far above email
This layer is what makes paid acquisition affordable rather than replacing it
Benchmarks to Judge Your Own Numbers Against
Benchmarks are a sanity check, not a target. Category and price point shift these a lot. The ranges below reflect aggregate ecommerce and lead-gen data reported through 2025 and 2026 by sources such as WordStream, Triple Whale and Storegrowers.
Channel | Typical CPC | Typical CPM | Conversion rate | Typical ROAS |
Google Search | $0.90–$1.30 | — | ~2.8% | 3–5x |
Google Shopping | $0.60–$0.75 | — | ~1.9% | 4–8x |
Meta prospecting | ~$1.07 | $13–$15 | ~1.5% | 2–3x |
Meta retargeting | Lower | Higher | 3–8% | 8–15x |
TikTok | $0.20–$2.00 | ~$9 | ~0.5% | 1.5–3x |
Email and messaging | Near zero | — | 3–10% | Very high |
How to Read These Properly
Shopping costs less per click than search but converts lower, so judge it on ROAS
Retargeting returns look spectacular because the audience was already warm
A 0.5% conversion rate on TikTok is normal and does not mean the channel failed
Costs rise 30% or more in peak season, but buying intent rises too
Average blended ROAS across platforms sits near 2.9x, so anything above 4x is genuinely strong
Metrics That Look Good and Mean Nothing
Every account has numbers that flatter. Here are the common false positives.
Looks good | Why it misleads | What to check instead |
High CTR | Curiosity clicks that never buy | Conversion rate |
Low CPC | Cheap traffic from weak placements | CPA |
High ROAS on brand campaigns | Capturing demand you already had | New customer CAC |
Falling CPA | Repeat buyers counted as conversions | First-time buyer CPA |
Rising conversions | Discount doing the work, not the ad | Contribution margin |
Platform revenue total | Every channel claims the same sale | MER |
How to Read an Ad Account in Ten Minutes
A repeatable sequence beats poking around. Run it in this order.
The Sequence
Check spend vs revenue at account level first. Calculate MER before opening any campaign
Split new vs returning customers. If growth is all repeat buyers, acquisition is not working
Sort campaigns by spend, not by ROAS. The biggest spender sets your blended result
Open the top spender and check its trend, not its average. A 30-day average hides a 7-day collapse
Look at frequency on prospecting. Above 3 in a week means fatigue
Check the landing page conversion rate, not just the ad metrics
Read the search terms or placements report for obvious waste
Seven steps. If nothing looks wrong after those, the problem is usually the offer or the website rather than the account.
What a Performance Marketer Actually Does All Week
Job descriptions make the role sound mysterious. The real week is fairly repetitive.
A Typical Week
Monday = check weekend spend and results, pause whatever broke
Tuesday = review creative performance and brief replacements for tired ads
Wednesday = audience and keyword work, negative keywords, search terms
Thursday = landing page and conversion checks, fix what is leaking
Friday = weekly numbers, budget shifts for next week, report to stakeholders
The Skills That Matter Most
Reading data without falling for vanity metrics
Basic arithmetic on margins and returns
Judging creative honestly even when you commissioned it
Patience during the learning period
Explaining results to people who do not live inside ad accounts
Most of the job is deciding what not to touch. Constant editing resets the learning phase and costs more than the bad spend it was meant to prevent.
Tracking Setup You Cannot Skip
None of the above works if the data is wrong. Broken tracking is the most common reason a healthy account looks like a failing one.
What You Need Live Before You Spend
Analytics with ecommerce or lead events firing correctly through to conversion
Platform conversion tags plus a server-side connection where available
Consistent UTM parameters across every campaign
Order or CRM data flowing back so real revenue is what gets optimised
One agreed definition of a conversion that everybody uses
Getting the analytics foundation right comes first. Our step-by-step walkthrough on setting up GA4 covers the events most accounts miss.
The Attribution Problem Nobody Warns You About
Add up the revenue your platforms report and it usually exceeds what landed in your bank. Nobody is lying. Every platform claims the same sale because every platform touched the buyer.
Why It Happens
A shopper sees a Meta ad, does not click, and searches your brand later
Google Search claims the sale on last click
Meta claims it too, because it served an ad inside the attribution window
Your email tool claims it as well, since they opened a campaign that week
What to Trust Instead
MER as the top-level truth, since it uses total revenue and total spend
New customer CAC rather than blended CPA, because repeat buyers flatter the number
Delivered revenue rather than orders placed, wherever returns are common
One view combining spend, revenue and margin. A simple KPI dashboard beats five platform tabs each telling a different story
For service businesses the same problem appears as lead quality. Volume looks healthy while nothing closes. Connecting ad platforms to your CRM and lead management system turns lead counts into pipeline numbers you can act on.
Fix the Website Before You Raise the Budget
More traffic to a page that does not convert simply costs more money. A one point lift in conversion rate does more for revenue than a 20% budget increase and costs nothing afterwards.
Checks That Come First
Does the landing page repeat the promise the ad made
Can someone buy or enquire in three taps from the page
Are prices, shipping and timelines visible before the final step
Does the page load in under three seconds on a mid-range phone
Do trust signals appear above the fold on mobile
Structural conversion problems are design problems, not ad problems. Our guide on designing a website that converts visitors into leads covers the layout decisions that move this number.
How Long Before You See Results
Expectations cause more conflict than performance does.
Stage | Timeframe | What to expect |
Learning phase | Days 1–14 | Unstable costs, do not judge yet |
First real signals | Weeks 2–4 | Direction becomes visible |
Meaningful optimisation | Days 30–60 | Winners and losers separate |
Fair judgement | Days 60–90 | Enough data to decide on the channel |
Shopping campaigns often show direction within two weeks. Cold social prospecting usually takes closer to six.
Where Performance Marketing Goes Wrong
The honest limitations, which most guides skip.
Real Limitations
It amplifies whatever conversion rate you already have. A weak site gets more expensive, not more profitable
Costs rise every year while conversion rates stay flat
Platform changes can reset results overnight through no fault of yours
Scaling something that looks profitable but is not is very easy to do quickly
It rewards short-term thinking if you never invest in brand or retention
Who Should Not Start Yet
Businesses with no working checkout or booking flow
Products under 20% margin with no repeat purchase
Anyone who cannot afford to lose the first month of spend entirely
Businesses with no conversion tracking installed
Teams who cannot handle the volume if it works
Your First 30 Days
Most people asking what is performance marketing really want to know whether it will work for their business. This plan answers that inside a month.
The Plan
Days 1–5 — install conversion tracking and verify every event fires
Days 6–10 — calculate contribution margin and set your break even ROAS
Days 11–15 — launch one search campaign and one social campaign, nothing more
Days 16–22 — collect data and resist editing anything
Days 23–26 — add retargeting once you have enough traffic for an audience
Days 27–30 — first real review, cut the worst 20%, double the best performer
What Success Looks Like at Day 30
Tracking you trust
A break even number you calculated yourself
One channel showing clear direction
A list of what creative worked and what did not
Enough information to decide whether to scale or stop
Performance Marketing in the Age of AI Search
Something is shifting that the standard playbooks have not caught up with. Buyers increasingly start with an AI assistant rather than a search box, and the shortlist forms before anyone sees an ad.
What Is Changing
AI Overviews answer product and service questions before the results page loads
Assistants like ChatGPT, Gemini and Perplexity name specific brands when asked for options
Those recommendations come from content, reviews and structured data rather than ad spend
Ads still capture the click, but the consideration set is decided earlier
What to Do About It
Publish comparison and buying-guide content that answers the questions people ask assistants
Keep product and organisation schema complete so machines can read your business
Build genuine review volume, because assistants weigh third-party signals heavily
Watch branded search volume as an early sign that AI visibility is working
Treat it as a layer beside paid media rather than a replacement
Brands that appear in AI answers see cheaper paid performance later, because recognition already exists. That groundwork sits inside AI search and GEO work rather than inside the ad account, but it directly changes what the ad account costs.
Conclusion
Performance marketing rewards the businesses that do the unglamorous parts properly. Know what an order is worth after every cost. Set your target from that number rather than from someone else's benchmark. Get tracking clean. Fix the website. Then spend patiently and scale only what clears the target.
The definition is easy. The arithmetic is where money is made or lost. Brands that get this right are rarely spending more than their competitors. They just know sooner which spend is working.
FAQ
What is performance marketing in simple words?
It is paid advertising where you only pay when a specific result happens such as a click, a lead or a sale. No result means no charge.
What does performance in marketing actually mean?
It refers to measurable outcomes rather than activity. A campaign performs when it produces countable results like sales or qualified leads, not when it simply reaches a lot of people.
How is performance marketing different from digital marketing?
Digital marketing covers everything online including SEO, content and organic social. Performance marketing is the paid slice where payment is tied to measurable outcomes.
Is performance marketing the same as affiliate marketing?
No. Affiliate marketing is one channel inside performance marketing. The model also covers paid search, paid social, retargeting, native ads, connected TV and more.
What is a good ROAS in performance marketing?
Divide 1 by your contribution margin to find break even, then aim above it. A business on 50% margin breaks even near 2x. A business on 20% margin needs 5x just to stand still.
How much budget do I need to start?
Plan for roughly ₹20,000 or $250 per channel per month as a floor. Below that the platform never collects enough data to optimise and you are paying for noise.
What does a performance marketer do?
They plan campaigns, manage budgets, test creative, read performance data and shift spend toward what works. Most of the role is analysis and restraint rather than constant editing.
Which channel works best for performance marketing?
Search usually delivers the most reliable return because intent already exists. Paid social is better at creating demand. Retargeting returns the most per rupee but is capped by audience size.
How long does performance marketing take to show results?
Expect early signals in two to four weeks and a fair judgement at sixty to ninety days. Shopping campaigns often move faster than cold social prospecting.
Can AI replace a performance marketing team?
Not fully. AI handles bidding, budget shifts and creative variations well. Deciding what to sell, to whom, at what target and when to stop still needs a person who understands the business.
About the author
Sr. SEO Executive · 3 years' experience
Harsh Rajput is a Senior SEO Executive with 3+ years of experience in SEO, digital marketing and AEO/GEO strategy. He leads a team of SEO executives at Digisutra Solutions, handling keyword research, technical SEO, on-page/off-page optimization, link building and content strategy, while helping brands rank in Google AI Overviews and LLM platforms like ChatGPT, Claude and Gemini. He has worked with clients across India, USA, UAE, and Australia in industries like e-commerce, finance and technology.
Reader reviews

Up next · Web & design · 7 min
Website Footer Design: Best Practices for UX and SEO

Related · SEO & AI search · 21 min
Technical SEO Audit Checklist Covering 47 Issues That Can Hurt Your Rankings